The mean of a sequence of numbers
![]() is the average:
is the average:
![]() ,
,![]() ,
,![]() ,
,![]() ,
,![]() ,
,![]() ,
,![]() ,
,![]() ,
,![]() ,
,![]() ,
,![]() ,
,![]() ,
,![]() ,
,![]() ,
,![]() ,
,
![]() ,
,![]() ,
,![]() ,
,![]() ,
,![]() .
.
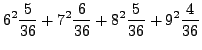
Compute the mean quiz score for this section.
There were ![]() scores in total. The sum is
scores in total. The sum is
![]() . Thus, the mean is
. Thus, the mean is
![]() .
.
The variance measures the extent to which individual data points differ from the mean. As with the sum of squares of errors we used to measure the fit of a recursion line to a data set, the variance is defined as the average of the sum of squares of ``errors'' where we treat the difference between a data point and the mean as an ``error''
Formally, the variance, ![]() , of the sequence of numbers
, of the sequence of numbers
![]() having mean
having mean ![]() is
is
The number
![]() is called the standard deviation.
is called the standard deviation.
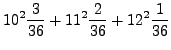
Compute the standard deviation for the quiz scores described above.
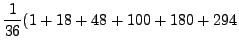
We compute the variance as
![]() .
.
And the standard deviation is
![]() .
.
We may present our data as a frequency table rather than as a list.
Given a list of numbers
![]() taking possible values
taking possible values
![]() we define the relative frequency of the value
we define the relative frequency of the value ![]() to be
the number of data points
to be
the number of data points ![]() for which
for which ![]() divided by
divided by ![]() .
.
Conventionally, this is written as
Note:
![]() and
and
![]() for every
for every ![]() .
.
| Score | Number of instances with this score | Relative frequency |
| 0 | 1 | 0.05 |
| 1 | 0 | 0 |
| 2 | 0 | 0 |
| 3 | 0 | 0 |
| 4 | 0 | 0 |
| 5 | 1 | 0.05 |
| 6 | 0 | 0 |
| 7 | 0 | 0 |
| 8 | 1 | 0.05 |
| 9 | 0 | 0 |
| 10 | 17 | 0.85 |
We may organize the information from a relative frequency table into a function, called a random variable.
Given a set of possible values ![]() and a sequence of numbers
and a sequence of numbers
![]() from
from ![]() , the random variable
, the random variable ![]() corresponding
to this sequence is the function defined by
corresponding
to this sequence is the function defined by ![]() the relative
frequency of the value
the relative
frequency of the value ![]() .
.
More generally, a random variable ![]() (on
(on ![]() ) is a function with
domain
) is a function with
domain ![]() having the properties:
having the properties:
Find the random variable expressing the relative frequency of the values for the sum of the numbers shown on two dice.
That is, list all the possible pairs of dice throws,
![]() and then take the data points to the sums
and then take the data points to the sums
![]() and find a random variable expressing the relative
frequencies for these data.
and find a random variable expressing the relative
frequencies for these data.
| Value | Sums giving this value |
| 2 | |
| 3 | |
| 4 | |
| 5 | |
| 6 | |
| 7 | |
| 8 | |
| 9 | |
| 10 | |
| 11 | |
| 12 |
So
![]() ,
,
![]() ,
,
![]() ,
,
![]() ,
,
![]() ,
,
![]() ,
,
![]() ,
,
![]() ,
,
![]() ,
,
![]() , and
, and
![]() .
.
One may compute the mean of a data set from its corresponding random
variable. (Called in this case the expected value of ![]() , or
, or
![]() ).
).
Let
![]() be a sequence of numbers with
corresponding random variable
be a sequence of numbers with
corresponding random variable ![]() and possible values
and possible values
![]() .
.
 |
|||
 the number of the number of |
|||
 |
|||
Likewise, we may compute the variance of a data set from its random variable. Keeping the notation of the previous example,
 |
|||
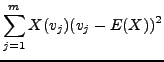 |
|||
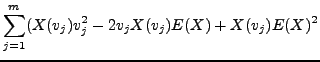 |
|||
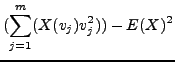 |
|||
Compute the variance for the dice example.
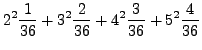 |
|||
 |
|||
 |
|||
 |
|||
while ![]() . Thus,
. Thus,
![]() and the standard deviation is
and the standard deviation is
![]() .
.